   ___                _    _                    _
  |_  |              | |  ( )                  | |
    | | __ _ _ __ ___| | _|/ ___  __      _____| |__
    | |/ _` | '__/ _ \ |/ / / __| \ \ /\ / / _ \ '_ \
/\__/ / (_| | | |  __/   <  \__ \  \ V  V /  __/ |_) |
\____/ \__,_|_|  \___|_|\_\ |___/   \_/\_/ \___|_.__/

------------------------------------------------------------------------------------------------------------------------------------------------------------------------------------------------------------------------------------------------------------------------------------------------------------
GRAPHPLOTTER
--
--
This is my simple script with tkinter GUI and matplotlib in tkinter. What this does, is that it takes an input of what the y value is and the draws the function in the graph. You can have multiple plots in one graph and can clear/export them as image. It also creates the legend automatically
image of the script with sample graph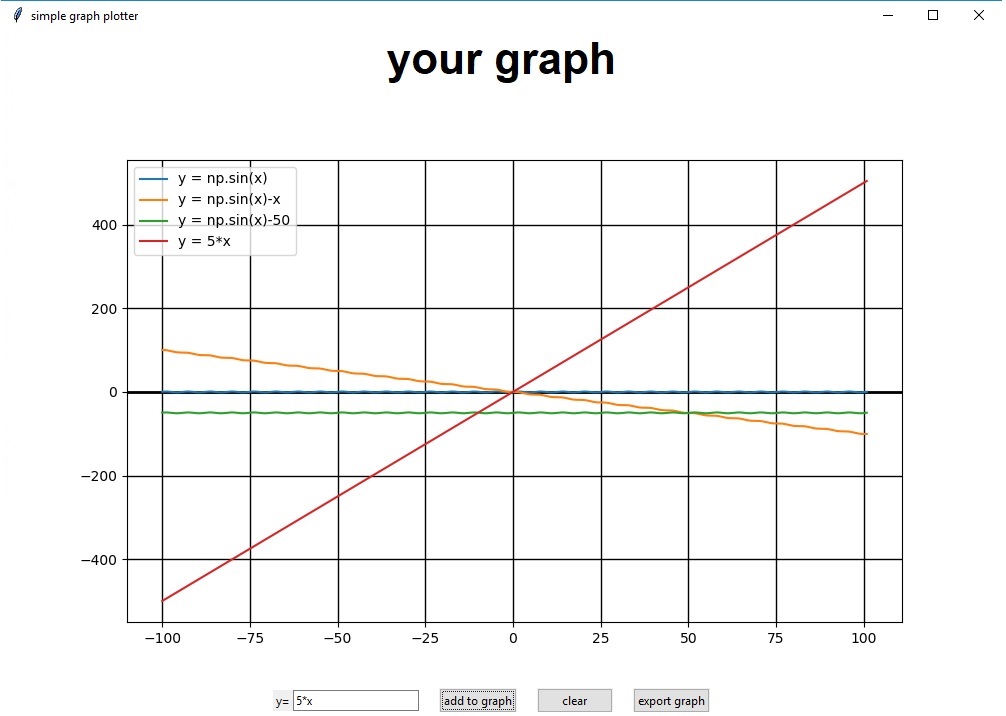
import numpy as np
import matplotlib
matplotlib.use("TkAgg")
from matplotlib.backends.backend_tkagg import FigureCanvasTkAgg, NavigationToolbar2TkAgg
from matplotlib.figure import Figure
from tkinter import *
from tkinter import messagebox
import tkinter.ttk as ttk

root = Tk()
root.configure(background='white')
root.wm_title("simple graph plotter")

#lenght od the x axis
x = np.arange(-100, 101, 0.1)
#functions

def makeplot():#fun of b1
    global x
    global y

    try:
        inp = str('y = ' + e1.get())
        exec(inp,globals())
        a.plot(x,y, label = inp)
        a.legend()
        canvas.draw()
    except:
        messagebox.showinfo('error prob. caused by you','something went wrong, try checking if what you inputed is mathematically possible')


def delete(): #fun of b3
    a.clear()
    a.grid(color='k', linestyle='-', linewidth=1)
    a.axhline(0, color='black', lw=2)
    canvas.draw()
def export():#fun of b2
    try:
        f.savefig('graph.jpg')
        messagebox.showinfo('picture saved', 'your picture was succesfuly saved as graph.jpg')
    except:
        messagebox.showinfo('couldnt save', 'for some reason the graph picture couldnt be saved, try checking if windows doesnt require admin rights in the folder this script is in.')


#set up frame 1 - graph frame
f1 = Frame(root, background = "White")
f1.grid(row=0, column=0)
#set up frame 2 - controls frame
f2 = Frame(root, background = "White")
f2.grid(row=1, column=0)

#f1 widgets
la1 = Label(f1, text = "your graph", font=('arial', int(f1.winfo_screenheight()/32), 'bold'), bg = 'White')

f = Figure(figsize=(10,6), dpi=100, frameon = False)
a = f.add_subplot(111)
a.grid(color='k', linestyle='-', linewidth=1)
a.axhline(0, color='black', lw=2)
canvas = FigureCanvasTkAgg(f, master=f1)
canvas.draw()
canvas.get_tk_widget().pack(side=BOTTOM, fill=BOTH, expand=True)
#f2 widgets
la2 = Label(f2, text='y=')
e1 = ttk.Entry(f2)
b1 = ttk.Button(f2, text = 'add to graph', command = makeplot)
b2 = ttk.Button(f2, text = 'export graph', command = export)
b3 = ttk.Button(f2, text = 'clear', command = delete)
#display widgets
#f1
la1.pack()
#f2
la2.pack(side='left')
e1.pack(side='left')
b1.pack(side='left', padx=20)
b3.pack(side='left')
b2.pack(side='left', padx=20)

root.mainloop()
download script
--
BY JAREK
------------------------------------------------------------------------------------------------------------------------------------------------------------------------------------------------------------------------------------------------------------------------------------------------------------